A 15-week trial found links between muscle growth and strength gains, but its very high correlations need cautious interpretation.
A study of 39 men new to resistance training found that quadriceps growth and strength gains moved closely together over 15 weeks. But its headline correlations—0.89 and 0.92—don’t establish that muscle growth explains nearly all strength improvement. The statistical method can produce high correlations even when two kinds of change are unrelated.
That distinction matters. Muscle growth probably contributes to strength gains, and this study adds useful evidence. Its results also show why a correlation coefficient needs to be read in the context of how it was calculated.
What researchers have generally found
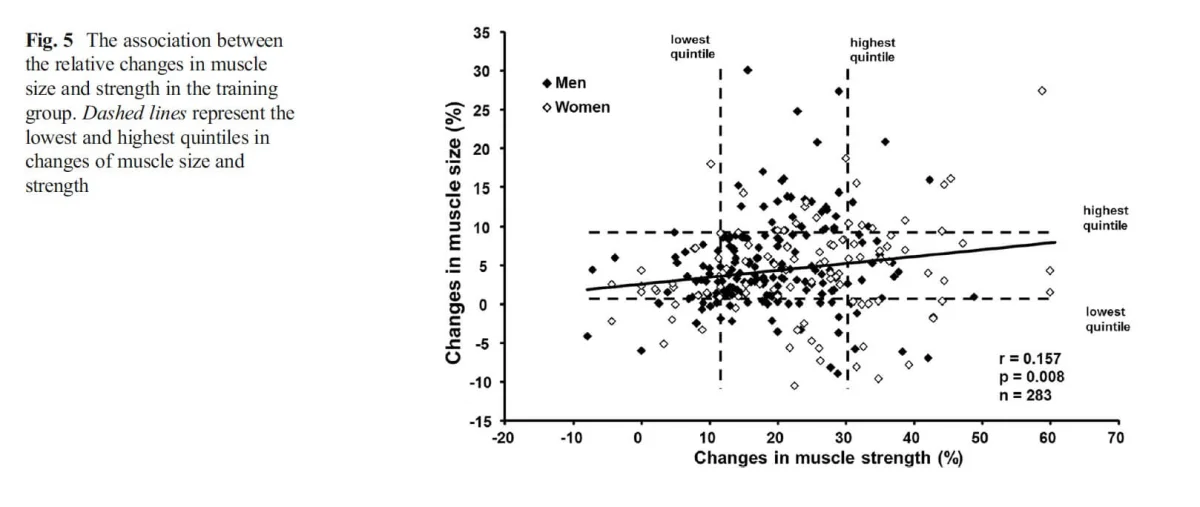
Earlier research often found a weak link between muscle growth and strength gains in people who were new to lifting. The association tended to be stronger among people with more training experience. Some studies of experienced lifters have reported that muscle growth explains a substantial share of differences in strength gains, though samples in this group are often small.
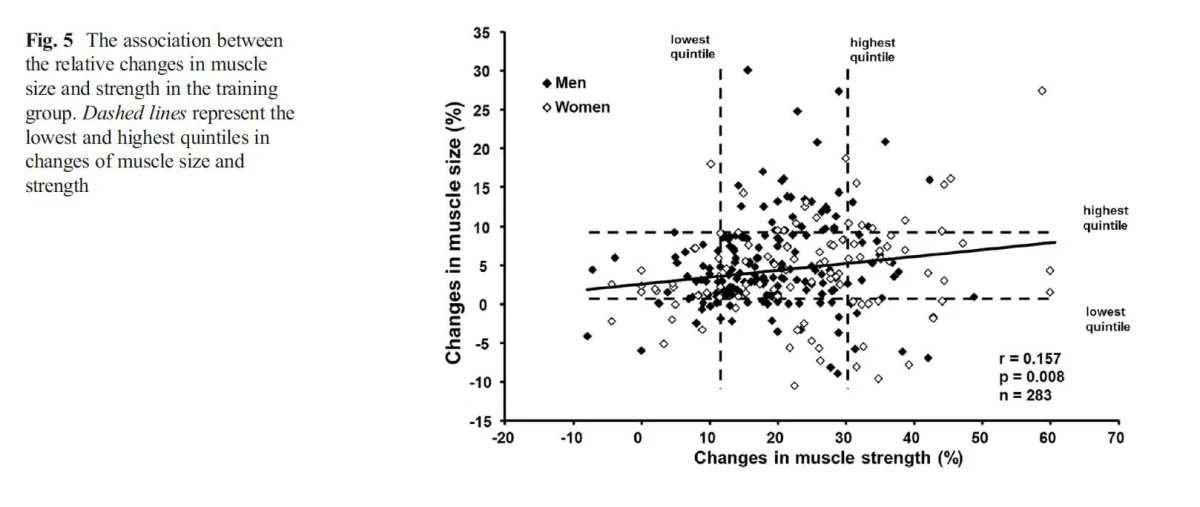
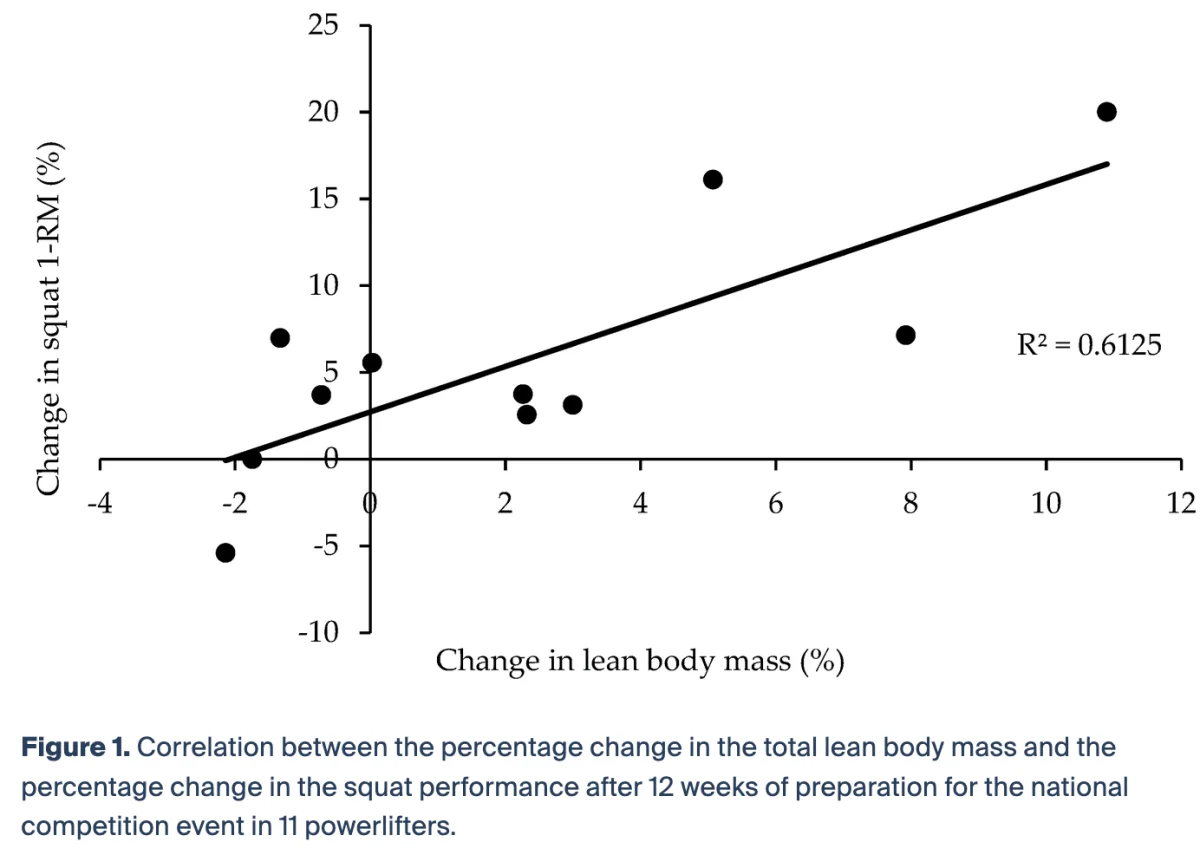
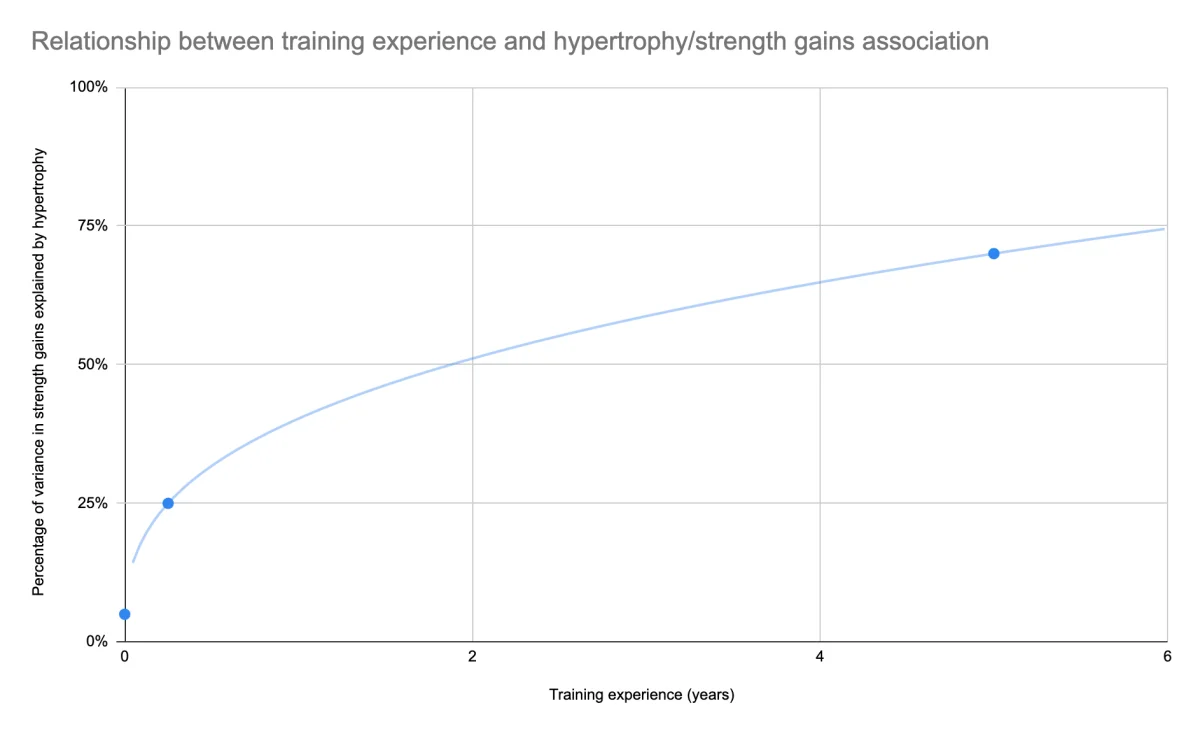
That pattern has a plausible explanation. Strength depends on more than muscle size. People who are learning a lift can improve through practice, coordination, and technique, even before their muscles have grown much. In studies of untrained lifters, average muscle size gains have been reported at about 5%, alongside strength gains of about 22%. Even if muscle growth helps, it can account for only part of the increase when other influences are substantial.
As people become more familiar with a lift, there may be less room for large gains from learning the movement. Muscle growth could then account for more of the differences in strength progress between people. This is one reason the relationship may look different at different stages of training.
The author of the source article has previously discussed this topic in Size vs. Strength: How Important is Muscle Growth For Strength Gains?, a review of muscle growth as a contributor to strength gains in Exercise-Induced Myofibrillar Hypertrophy is a Contributory Cause of Gains in Muscle Strength, and articles on whether muscle growth increases strength potential and what strength data can tell us about muscle growth. A related discussion appears in More Training, More Gaining.
Why the new study used a different approach
Marques and colleagues asked whether earlier studies had understated the relationship by analyzing differences between people instead of tracking how two measures changed within each person. Their paper, Muscle Growth Is Very Strongly Correlated with Strength Gains after Lower Body Resistance Training: New Insight from Within-Participant Associations, argues that common methods may miss some of the relationship.
A typical between-person analysis compares each participant’s percentage change in muscle size with their percentage change in strength. It then asks whether people with larger muscle gains also tended to have larger strength gains. That gives one pair of changes per person.
A within-person analysis instead considers repeated measurements from the same participant. This can account for stable differences between people—such as limb proportions or muscle characteristics—that affect how much force they can produce. The study’s authors suggest that those personal differences can make the pre-training and post-training measurements dependent, and that treating them together may reveal an association obscured by comparing change scores across people.
A simple example helps explain the issue. Imagine two people with biceps of equal size. One has muscle attachments and contractile properties that give them a strength advantage; the other does not. If both gain the same percentage of muscle size, the first may gain more strength. A comparison of percentage changes across a group could therefore show a modest relationship, even if muscle growth contributes to strength within each individual.
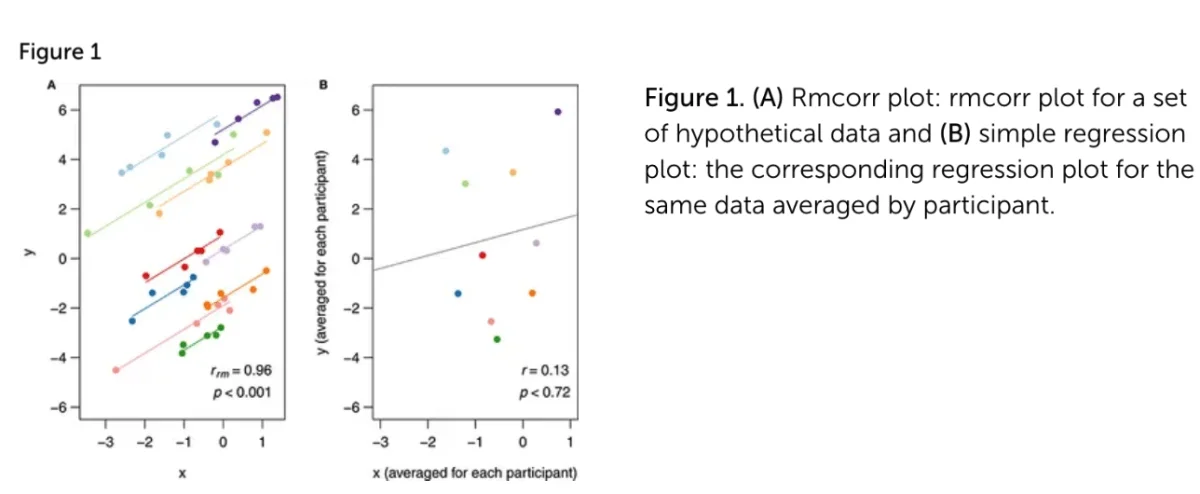
Repeated-measures correlation is one way to study within-person associations. In a theoretical example cited by the study authors, each person’s data follow the same general slope but start from a different baseline. Looking at each person’s pattern reveals a strong relationship; comparing people without accounting for their different starting points can obscure it.
Other statistical approaches have also tried to account for individual differences. A prior study by Vigotsky and colleagues, for example, used hierarchical linear models (HLMs) to let each person have a different starting point and a different relationship between muscle size and strength. In that study, between-person analyses found that changes in muscle size explained less than 5% of the variation in strength gains. The HLMs explained 7.4% to 24.1%, equivalent to correlations of roughly 0.25 to 0.50.
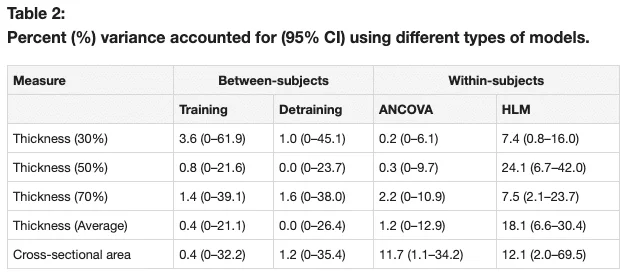
Those results support the idea that between-person comparisons can miss some of the association. But they also offer a useful point of comparison for the much higher figures reported by Marques and colleagues.
What the 15-week trial found
The Marques study enrolled 39 men with no prior resistance training experience. They completed 15 weeks of training focused on the quadriceps. Researchers measured quadriceps volume with MRI and assessed strength before and after the program, using both a knee-extension one-repetition maximum (1RM) test and a maximal isometric knee-extension test.
On average, isometric knee-extension strength rose by 21.6% (with a standard deviation of 9.2%). The 1RM increased by 28.6% (standard deviation 12.9%), while quadriceps volume increased by 12.7% (standard deviation 7.1%).

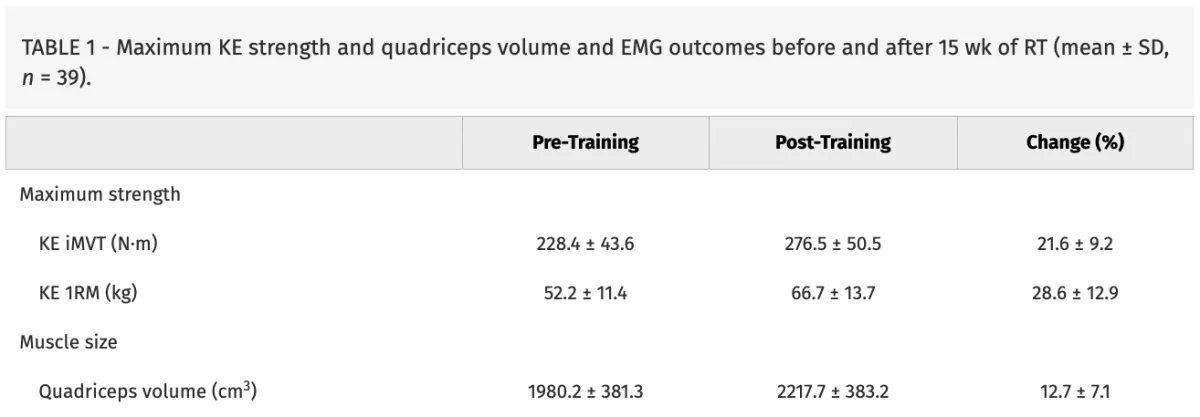
Using repeated-measures correlation, the researchers reported a correlation of 0.92 between muscle growth and isometric strength gains, and 0.89 between growth and 1RM gains. The study also reported more modest between-person correlations: 0.60 for isometric strength and 0.35 for 1RM.
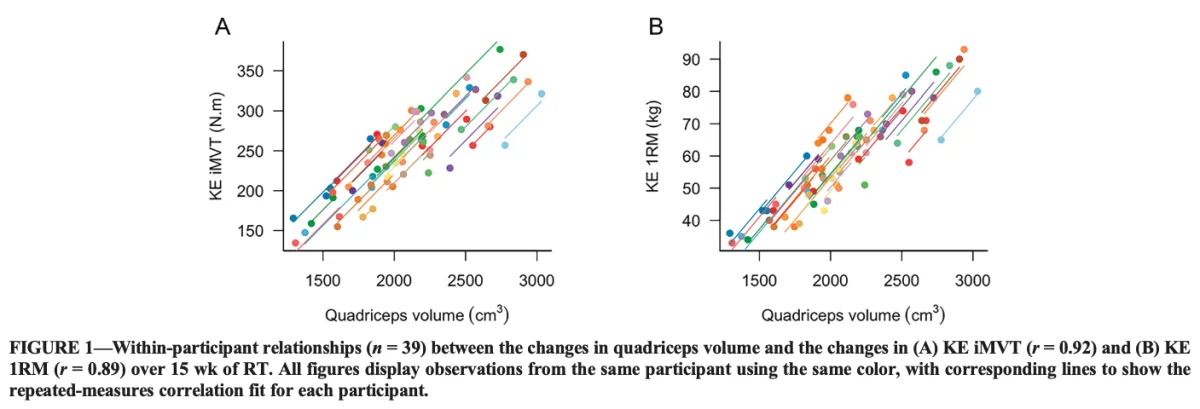
Read at face value, the repeated-measures results suggest that muscle growth accounts for about 85% of the variation in isometric strength gains and 79% of the variation in 1RM gains. That would be a striking result, especially in people new to lifting. But the key question is whether those percentages reflect a strong biological link—or partly a feature of the statistical method applied to two time points.
A simulated “no relationship” comparison
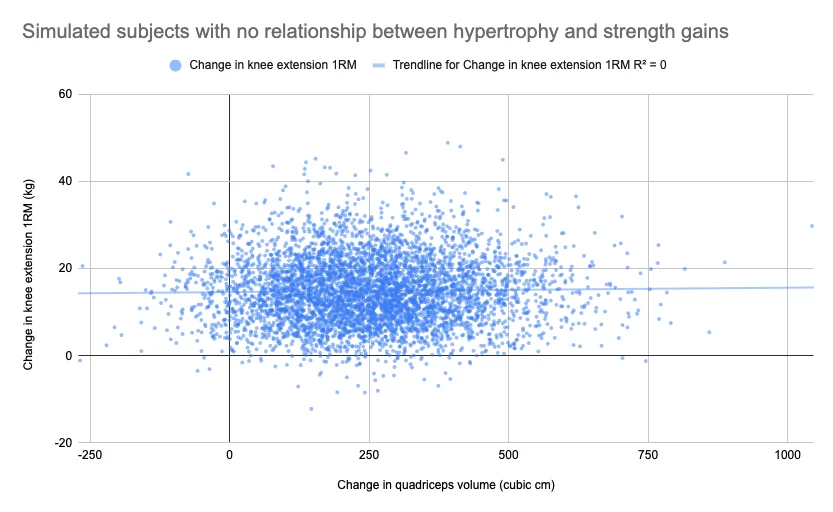
To examine that question, the source article’s author created a simulation with 5,000 fictional participants. The simulated data were designed to match the study’s reported averages, standard deviations, and changes in strength and quadriceps volume. Crucially, each person’s change in muscle volume was generated independently of their changes in strength. In this constructed example, the two outcomes had no relationship at all.
The author then calculated repeated-measures correlations for the simulated data. Even though the changes were independent, the method produced correlations between 0.81 and 0.83. In other words, a high correlation could appear in this particular setting even when muscle growth had no effect on strength.
The reason is tied to how the calculation treats the two measurements—before and after training—and the group’s average change. When both outcomes increase across the group, the analysis can capture that shared movement over time. With only two measurement points, the calculated correlation is also strongly affected by how variable the changes are from person to person.
That doesn’t make the method invalid. It does mean that a repeated-measures correlation around 0.9 may not carry the same practical meaning as a correlation around 0.9 from a conventional comparison of people. The number alone doesn’t tell us how much of the relationship is due to a true link between individual changes.
Here is how the simulation changes the interpretation of the study’s figures:
| Quadriceps volume and knee-extension 1RM | ||
|---|---|---|
| Analysis | r | r2 |
| Between-person correlation | 0.35 | 0.12 |
| Repeated-measures correlation | 0.89 | 0.79 |
| Additional variation explained after accounting for the simulated no-relationship result | — | 0.37 |
| Quadriceps volume and isometric knee-extension torque | ||
|---|---|---|
| Analysis | r | r2 |
| Between-person correlation | 0.60 | 0.36 |
| Repeated-measures correlation | 0.92 | 0.85 |
| Additional variation explained after accounting for the simulated no-relationship result | — | 0.53 |
The “additional variation” figures are the repeated-measures results after subtracting the level that appeared in the simulation with no relationship. They suggest a meaningful association, but one much less extraordinary than the raw values of 0.89 and 0.92 imply. The author’s interpretation is that hypertrophy may explain roughly 37% of the variation in 1RM gains and 53% in isometric strength gains under this adjusted comparison.
That adjustment is a way to understand the result, rather than a standard replacement for the reported analysis. The simulation depends on assumptions about the data and the method. Still, it demonstrates why a null comparison tailored to the study’s summary statistics can add useful context.
The paper’s 1RM correlation of 0.89 also came with a confidence interval of 0.81 to 0.94. The simulated no-relationship result of about 0.82 sits inside that interval. That means the study’s estimate does not clearly separate from the correlation produced by the simulated null case, using the comparison described in the source article.
What this does—and doesn’t—say about muscle growth
The results don’t show that muscle growth is irrelevant to strength. Nor do they prove that it explains nearly all strength gains in beginners. A more measured reading is that the conventional between-person correlations may understate the relationship, while the repeated-measures values may make it look stronger than the data can support.
The study’s conventional correlations were higher than those often reported in studies of untrained participants. That may partly reflect its design. Fifteen weeks is longer than many training studies in beginners, allowing larger changes in muscle size and strength. Larger real changes can make measurement noise a smaller part of the observed result.
The researchers also used maximal isometric knee-extension torque, a strength measure that requires little movement skill. That may reduce the influence of differences in how quickly participants learn a lift. By contrast, a 1RM test depends more on familiarity with the movement, so technique and practice can shape the result alongside physical changes.
Other factors also complicate the link. Muscle size is one contributor to force, but strength tests measure performance in a particular task. Personal anatomy, muscle properties, measurement error, practice, and test setup can all influence the result. This is why a group-level correlation cannot tell an individual how much strength they should expect from a particular amount of muscle growth.
The study authors’ choice to examine within-person associations is reasonable, and the study itself appears methodologically strong in the source author’s assessment. The main concern is how easily an unadjusted correlation near 0.9 can be interpreted as evidence of an almost perfect relationship. Simulations of data with no relationship suggest that interpretation needs care.
Why measurement timing matters
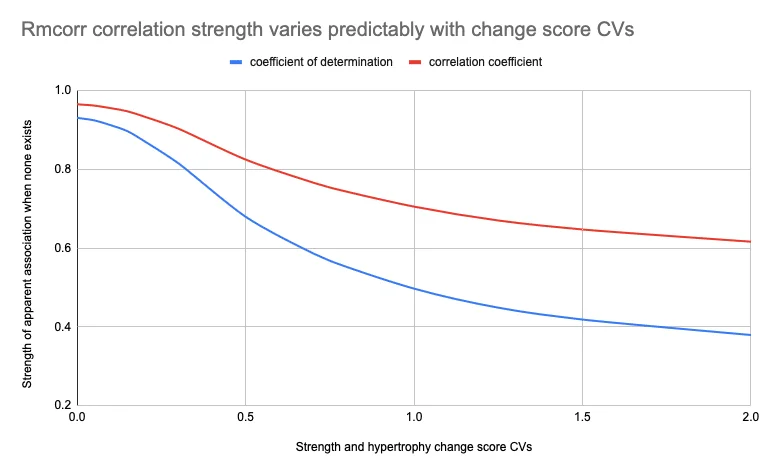
Repeated-measures correlations may be especially sensitive when a study has only two time points: before and after training. In the source article’s analysis, these correlations were affected far more by the variability in participants’ change scores than by their starting values or average changes.
Strength and muscle-growth studies often have considerable variation in change scores. A coefficient of variation (CV) compares the spread of those changes with their average. When both outcomes rise and their CVs are around 0.5 to 1.5, the author’s simulations suggest that repeated-measures correlations between 0.65 and 0.85 can occur even when the outcomes are largely unrelated. The smaller the CVs, the higher the correlation can be in the simulated no-relationship case.
A second simple example illustrates the point. The author generated two variables with starting values centered on zero. One increased by an average of one unit and the other by three units, with random variation around those changes and no connection between them. Despite their independence, the repeated-measures correlation was 0.83.
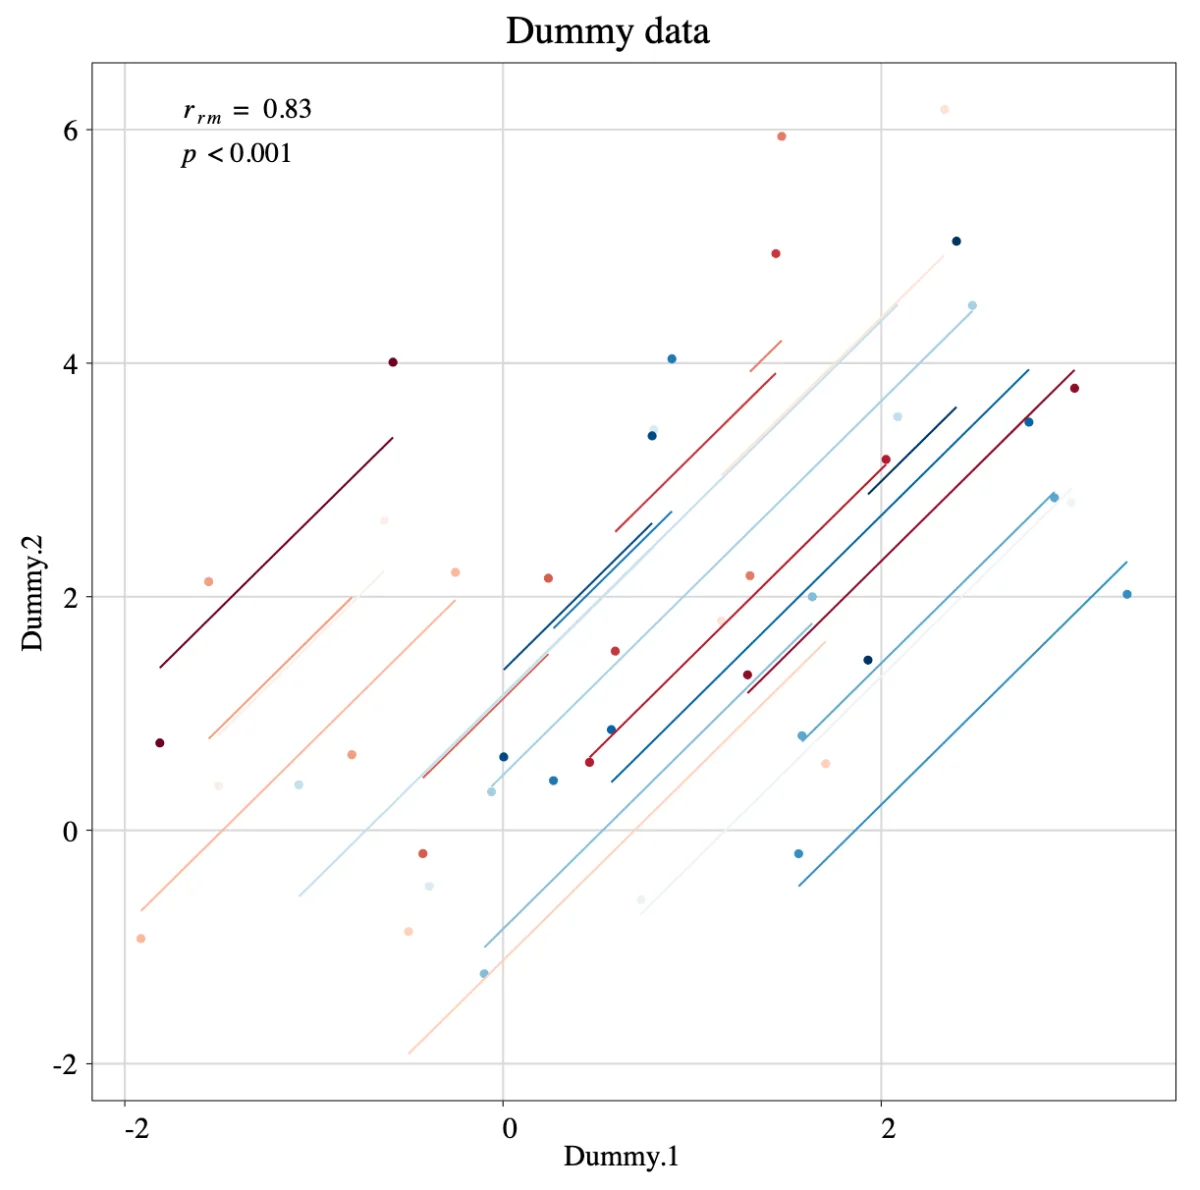
A conventional Pearson analysis of the changes correctly showed no correlation in that example.
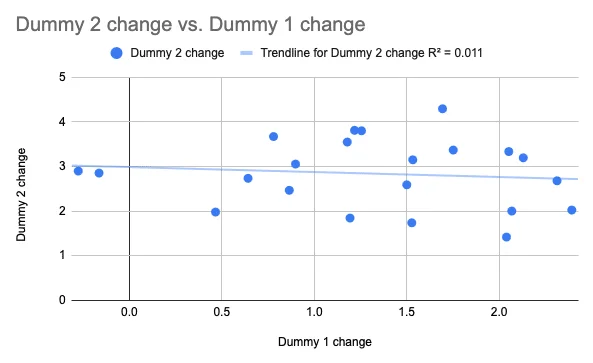
These examples don’t mean repeated-measures correlation is a poor tool. It answers a different statistical question and may help account for personal baselines. The problem is treating its output as if it carried the same interpretation as a standard correlation between people’s changes.
What researchers and readers can take from this
For researchers, the source article argues that simulated null data should be part of interpreting repeated-measures correlations. A simulated dataset can match the study’s expected or observed averages and variability while making the outcomes independent by design. The resulting correlation provides a reference point for the size of the value that the method might generate without a true link.
In this view, the distance between the observed result and that null reference may be more informative than the raw correlation alone. The source article points to a web-based tool for repeated-measures correlation, maintained by authors of a paper on the method, as a way to run the calculation. It also recommends a study design with at least three measurement points—before, during, and after training—when feasible.
More measurement points can help show whether muscle size and strength changes track together over time. If the relationship weakens when researchers include an additional time point, that would be a reason to revisit how much the two outcomes predict each other. A prior study by Vigotsky and colleagues included a third measurement and a period without training. The source author suggests those design features may help explain why its correlations were lower. If muscle size helps predict strength gains, tracking strength during muscle loss may also help test how closely the two move together.
For readers, the practical lesson is narrower: this study supports a connection between muscle growth and strength progress, but it doesn’t settle how much growth predicts strength for a particular person. The trial involved 39 untrained men, focused on the quadriceps, and lasted 15 weeks. Its findings don’t directly establish what happens in women, experienced lifters, other muscle groups, or different training programs.
People weighing changes to exercise routines or interpreting their own progress may find it useful to discuss their goals and circumstances with a qualified health professional, such as a physiotherapist or physician. The study doesn’t provide a basis for changing treatment or making health decisions.
The best reading is that muscle growth probably contributes more to strength gains in beginners than some conventional analyses suggest. The evidence doesn’t support taking a repeated-measures correlation near 0.9 as proof that growth explains nearly all strength improvement. Future studies with more measurement points and careful comparisons against simulated null results should help clarify the size of the relationship.
1 The source author recommends using three or more time points when designing studies around repeated-measures correlation. With only before-and-after measurements, the result may be driven largely by the variability of change scores. Additional observations can test whether the association holds across the training period, though the strength of a correlation still needs to be interpreted in light of the study design and measurement quality.
Related reading includes the prior analysis by Vigotsky and colleagues, the paper on the principles of repeated-measures correlation, and the training-study data discussed in this preprint.